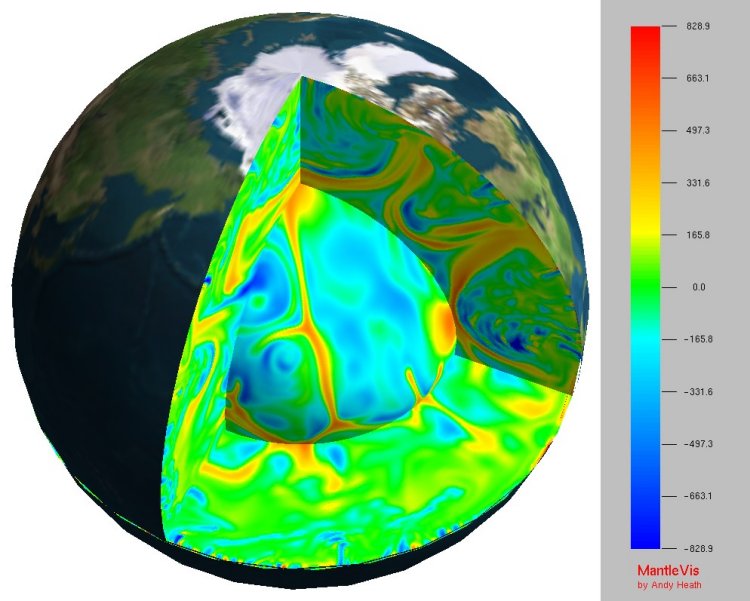
The parallel
TERRA code, which simulates mantle dynamics, generates very large
amounts of data. Classic methods of visualising this type of 3D volume model
do not cope with the mantle problem efficiently. The approach taken by
MantleVis exploits the geometry inherent in the data organisation and
uses a Beowulf cluster to render images derived from over 100 million data
points.
The software runs on the
NESSC
supercomputer and on
Helix,
a parallel visualisation system at Cardiff University in Wales. MantleVis
has also been used at Princeton University in the USA.
Several
data domains are stored on each server (commonly 128 servers were used). The
client sends out a request, such as a cross-section, to each server in turn.
The servers respond by sending the coordinates of a 3D polygon back to the
client along with the associated texture map required to paint the polygon.
The client awaits all the server responses and then renders them into 3D
space.
Circulation model (Huw Davis, Cardiff
University)
MantleVis does
not use MPI to pass messages between the client and multiple servers. There
is no requirement for the client and servers to be located at the same site:
MantleVis (or another visualisation tool based upon this technology)
is an ideal candidate for implementation on a
GRID. The work shown here
was done outside any particular proposal and was not funded: the work was
carried out in my own time.
Plume animation (Huw Davis, Cardiff
University)
The
software creates 3D views of the data including cross-sections and various
types of surface. The user can interactively control the position and
orientation of the visualised model. Clipping planes optionally remove parts
of the model in front of cross-sections and several planes can be applied
simultaneously. Data values are textured across graphical fragments by
interpolation and a colour lookup table.
The client reads a
list of requests from a text file and builds a menu to allow user control of
display elements. The popup menu is attached to the right mouse button. The
left mouse button is used to control model rotation and the middle button
controls zoom. A 3D 'compass' is provided to help guide orientation around
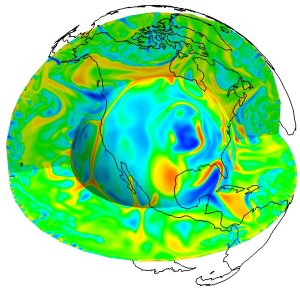
the model. Continents and tectonic boundaries are used to aid location
finding.
Continental boundaries
superimposed
Data domains inherited from
TERRA
Interaction
between connected servers and the single client happens within a separate
thread of execution - the client employs one thread per server. The
asynchronous nature of communication between client and its many servers
reduces the possibility of a network bottleneck forming. Calculation results
from a given server are sent to the client synchronously. Each server
handles many data domains and each domain can potentially supply a display
fragment to the client. A server creates the graphics instructions and data
associated with a display request using one thread per domain. OpenGL
display lists are used by the client to ensure only one network round trip
per display request is required no matter how many times a particular view
is selected.