
|
|
|
|
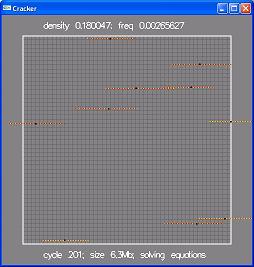
Cracker |
|
|
|
Geological outcrop studies of purely dilational (Mode I) fractures (e.g. joints and veins) suggest that fractures with straight, regular fracture paths and an absence of forking to be diagnostic of the slow, stable fracture growth associated with subcritical or quasi-static crack-tip propagation. This mode of fracturing may be the norm under conditions of long-term loading, which are likely to be widespread throughout the crust. Furthermore, fractures resulting from subcritical growth have been recognised as the principal element of fracture porosity in several hydrocarbon reservoirs. As these fractures are generally steep, intersections by boreholes and wells are infrequent, making these systems difficult to characterise. Thus accurate simulation of these fracture systems can help provide geometrical templates for the incorporation into fracture flow models and therefore may be of economic benefit. |
|
|
|
|
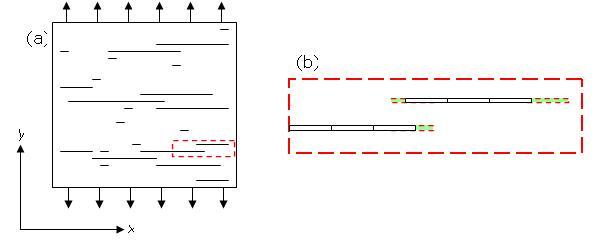
The Cracker software numerically simulates the growth and interaction of Mode I fractures in 2-dimensions by implementing Linear Elastic Fracture Mechanics theory (LEFM). A schematic of the boundary conditions used by Cracker to simulate fracture growth is shown in Figure 1. An initial distribution of uniformly oriented flaws of specified half-length distribution (delimited random or constant) and spatial distribution (random uniform or pseudo-grid) populates a finite 2-dimensional body. During each iteration of the simulation, a constant remote uniaxial tensile stress is simulated perpendicular to the flaws. Each model element that comprises the fractures, the stress and extensional displacement is calculated according to LEFM. Calculation of the stress intensity at the tip of each fracture is determined and the crack propagated perpendicular to the applied stress by a straight-line distance proportional to stress intensity and the specified fracture toughness. The simulation is terminated when a specified dimensionless fracture density or maximum fracture length is reached. |
|
|
|
|
|
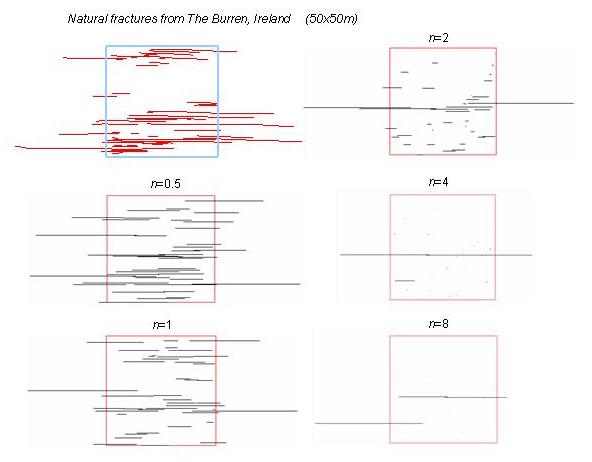
Comparison of natural subcritical fracture pattern mapped from aerial photographs with numerical simulations of fracture patterns using Cracker. All simulations are seeded with 50 flaws but have different fracture toughness values (n), which result in starkly contrasting fracture patterns |
|
|
Fracture toughness, n, also known as the subcritical fracture growth index, is a key variable in the numerical simulations, which determines the sensitivity of crack-tip velocity to stress intensity at the crack-tip. Using Cracker, it has been possible to demonstrate that realistic fracture patterns can be simulated using low values for fracture toughness (n ≤ 2)(Figure 2). These values are in stark contrast to laboratory determinations of fracture toughness, which range 26-130 for limestone rocks. The discrepancy between these determinations of n can be rationalised by consideration of fracturing in fluid-saturated conditions which, it is derived, must limit fracture toughness to values of 2 or less. |
|
|
|