
|
|
|
|
ACDCvis |
|
|
|
I developed ACDCvis in collaboration with Prof. R. Paul Young as a work package of the EU-funded SAFETI project. The software visualises both experimental and simulated data in the same environment allowing direct comparisons to be drawn. The experimental data are seismology measurements taken from potential burial sites of nuclear waste; calculations performed by a special parallel version of PFC3D™ provide the simulated results. |
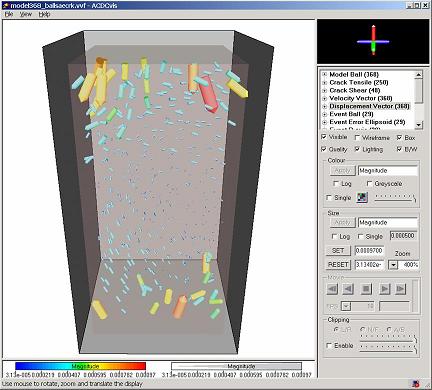
The picture shows displacement vectors representing movement of particles within a rock continuum. The colour and size of the 3D arrows represent the magnitude of displacement: red is the largest value. ACDCvis reads data from files produced by PFC3D™ and InSight™ (a package for collating and analysing seismology data). ACDCvis also connects to running PFC3D™ processes over the internet to allow a user to view progress of a active model. |
|
|
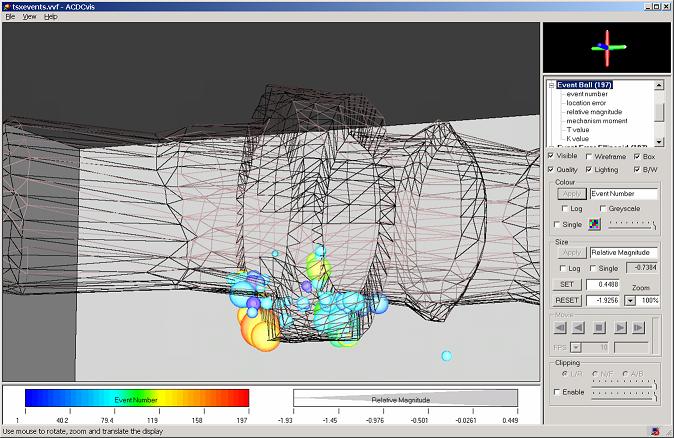
The picture below shows seismic
events measured within a tunnel. The events happen through time - ACDCvis
provides a facility to create a movie from the data. The movie can be
replayed using the VCR controls: paused, rewound and stepped through
frame-by-frame.
The project demands construction of very large models. The research consortium made use of NESSC, a 130 node Beowulf cluster, to create simulations on many different processors. ACDCvis combines results from each processor to create displays of huge models. |