|
 |
 |
 |
 |
 |
 |
Section 1: The Basics
Diffusion
Contents:
C:
As well as changing over time, epidemics also display very distinctive geographical patterns.
They are most likely to start from particular kinds of environment: those where the disease has remained in an endemic form - such as large urban centres with international airports - or, in the past, port cities.
Some epidemic diseases are strongly constrained by climatic conditions and the physical environment in general because the disease vector can only survive in such restricted environments. An excellent example of this is malaria (this is discussed in more detail in section 3).
The starting points for the spread of other diseases may be tied more closely to social and cultural environments. Drug users and prostitutes often concentrate in certain areas of towns or where clients can locate them more easily. In both cases there have been noticeable consequences for the clustering and subsequent spread of HIV-AIDS cases.

Spatial clustering of infectious disease cases has also been used to infer the causes of those diseases.
The most famous example of this must be the work of Dr John Snow in London during the 1850s. He mapped the deaths from cholera in the Soho area of London in 1854 and concluded that the source of the illness was the water supplied by the Broad Street pump.
His direct action in dismantling the pump saved many lives at a time when the aetiology (causal mechanism) of the disease was not understood in scientific terms.
The map below shows the distribution of cholera deaths around the water pump.
The red lines represent the number of deaths. It is clear to see that there are more deaths nearer the pump. This simple observation led Snow to link the outbreak of cholera with the quality of the water from the pump.

Map re-drawn from Cliff et al. 1988, p.50
Epidemic diseases diffuse in ways that follow recognisable spatial patterns. These patterns can be modelled and reproduced and even predicted to some degree.
The mechanism of communication (how the disease spreads) is influenced by population distribution, by the layout of transport routes and by chance.
Iceland has proved an excellent real world laboratory for the study of measles epidemics in the past, in ways that capture both the time dimension (epidemic waves) and the spatial dimension (diffusion through a settlement network).
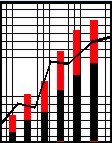
The graphs on the epidemic wave page showed the time dimension of measles in Iceland (click here). The map below shows the spatial dimension.
Click on the moving image to see each month individually.