The first grey row shows results from my Multiscale Mathematical Analysis and Modelling Laboratory
Mathematical analysis
Mathematical modelling
| Electron Backscatter Diffraction
data Since 1998 I have written code to analyse EBSD data in various ways. 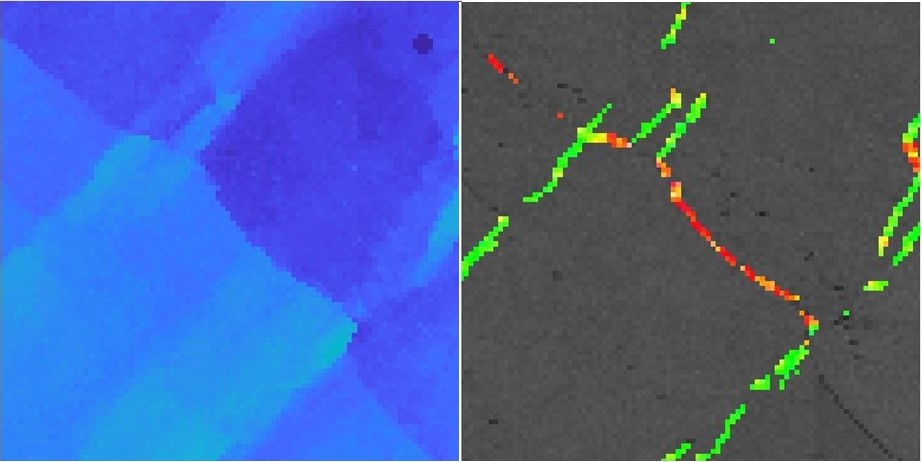 One technique I have developed is for analysing dislocation density. The left picture shows a map of distorted olivine, colour coded for misorientation relative to a reference point. The right picture shows subgrain walls colour coded for the direction of likely Burgers vectors using a technique I developed. Green indicates the [100] direction and red is [001], so such maps can assist in diagnosing active slip systems. Read more about EBSD. (Thanks to Jake Tielke for this dataset). |
| Geochronological data I developed a model to examine the effects of thermal history on apparent age profiles within grains. 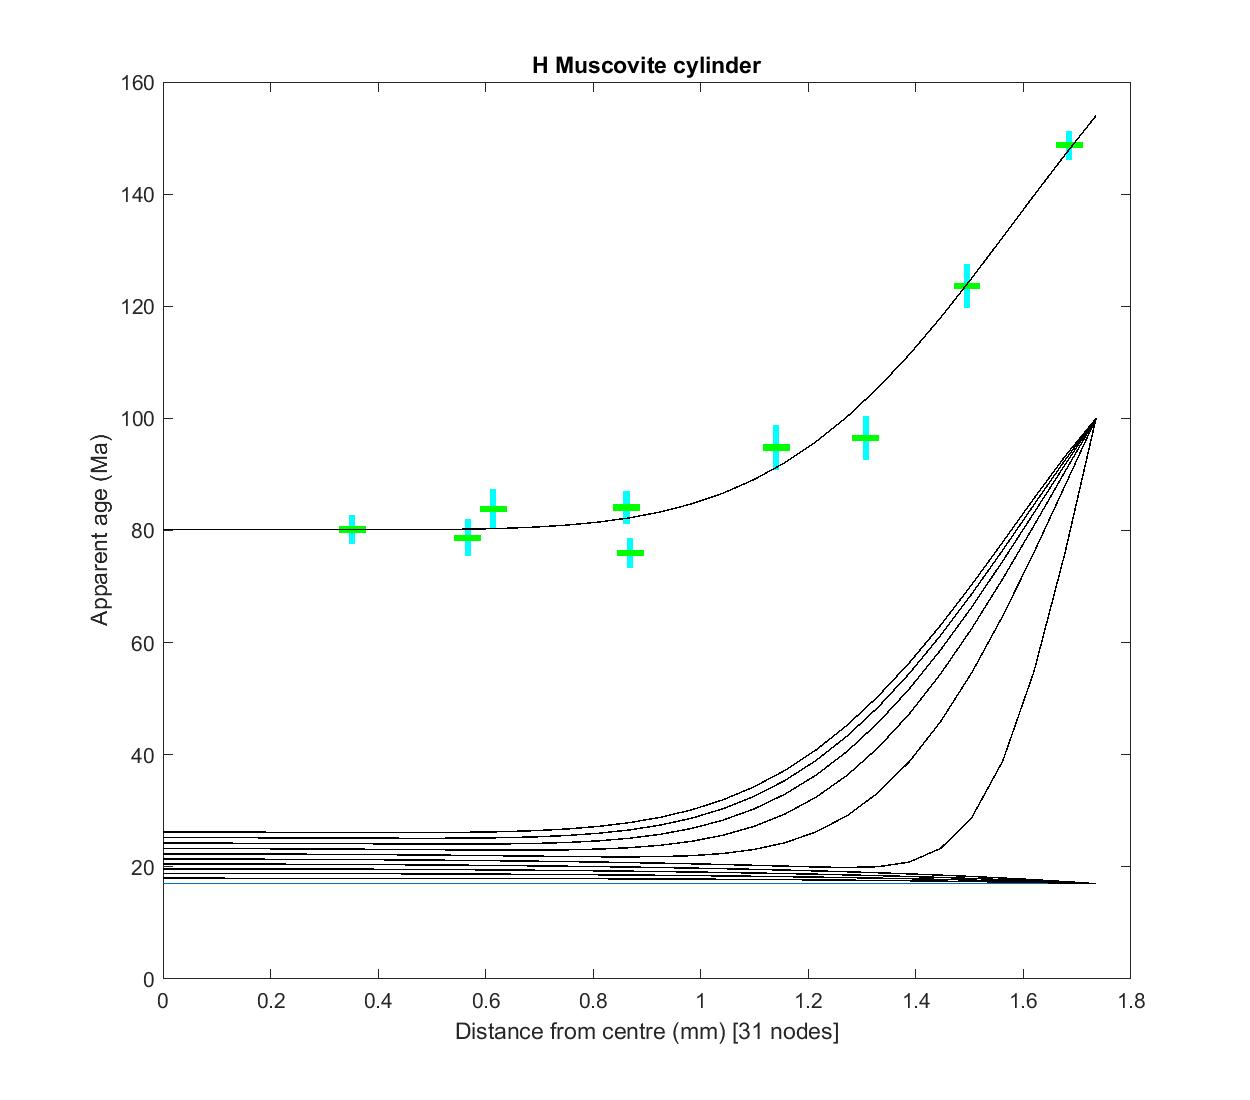 The diagram shows the apparent age profile (crosses) and a modelled profile for a phengite in an eclogite facies rock from the Sesia Zone, Italian Alps. Animation of profile development here Animation of profile development and the imposed temperature and excess argon histories here |
| Interactions
between stress and chemical processes in the Earth. My approach is to show how theory which is already used to describe many phenomena in the Earth can be extended to give new insights, and stimulate new experimental tests. Not easy to summarise in pictures but for the story behind my research in terms of papers see here. |
Diffusion
creep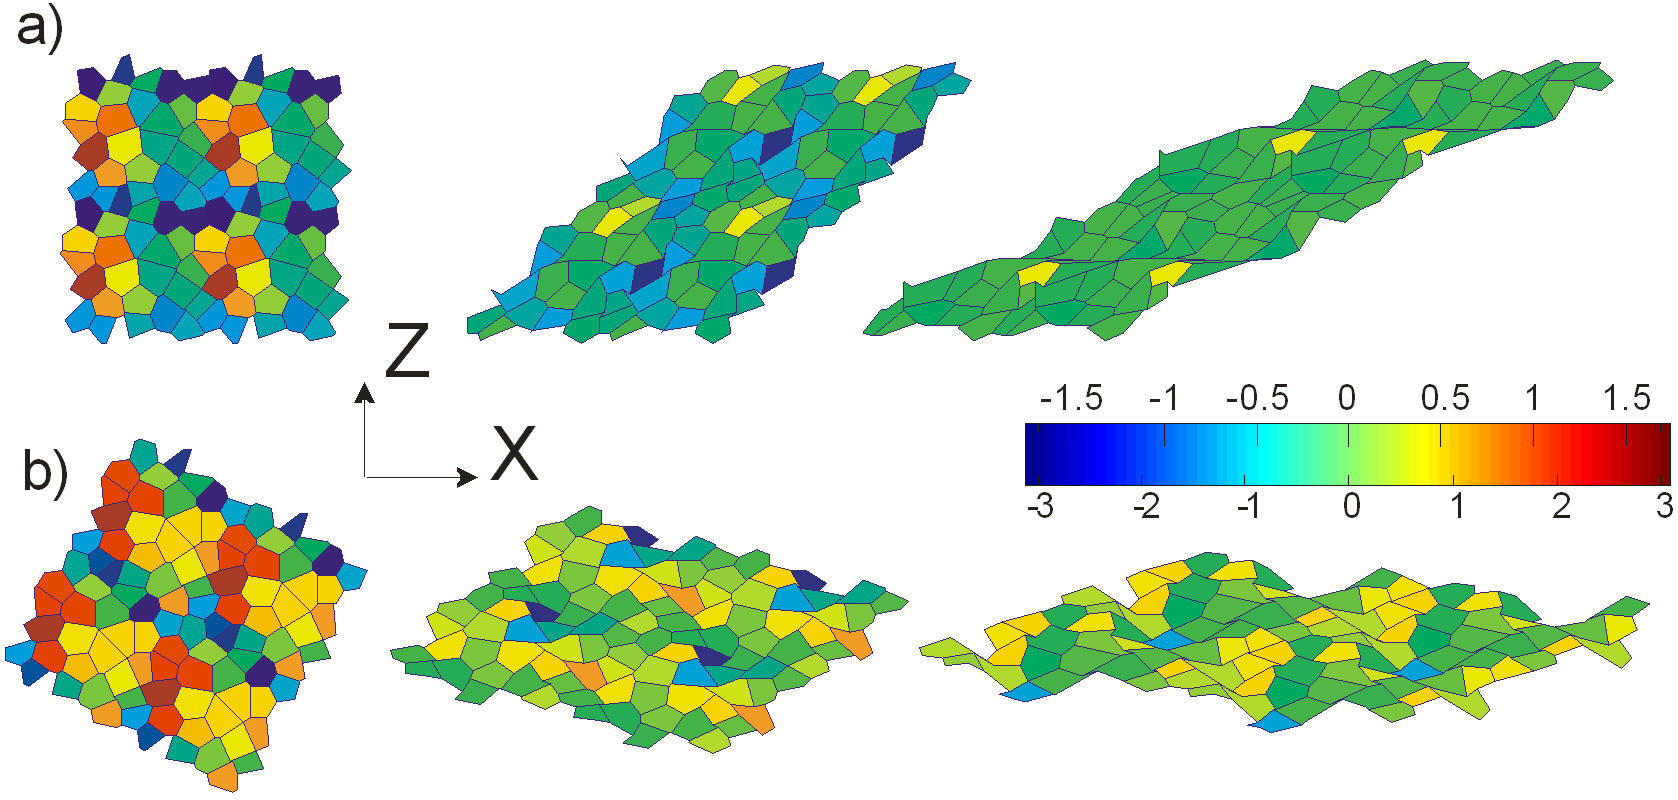 This is one process in which stress affects chemical movements. The picture shows a model rock deforming by diffusion creep, with each grain colour coded for angular velocity. Angular velocity matters because as grains rotate the crystallographic preferred orientation is changed, which affects seismic anisotropy and also the way we interpret natural rocks. The picture also shows how grain boundaries align, creating joined up easy slip surfaces. Read more about diffusion creep |
Reactive
fluid flow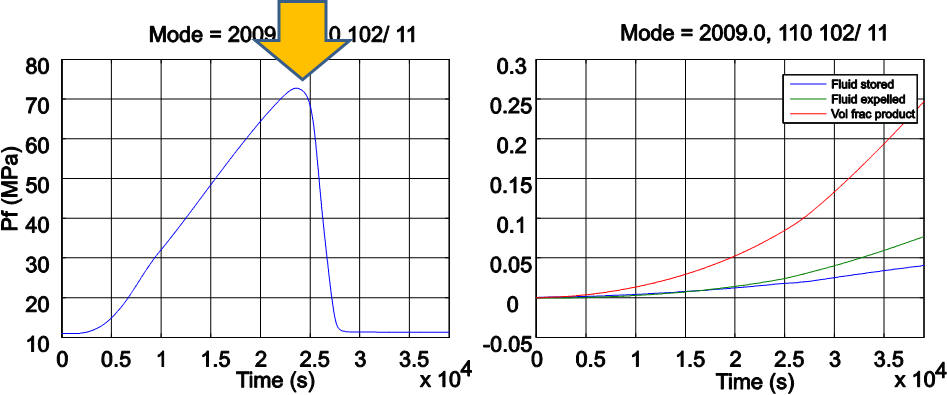 These graphs are from a model of fluid pressure (Pf) evolution in response to dehydration reaction at the undrained end of an experiment (see below). |
Nature on all scales from microns to km
Experiments
| Evolution of the Lewisian
Complex of NW Scotland Because it largely lacks metasediments it is difficult to constrain the pressure-temperature history of the Lewisan Complex. However the quartzofeldspathic gneisses are full of zoned plagioclase which must tell a story. 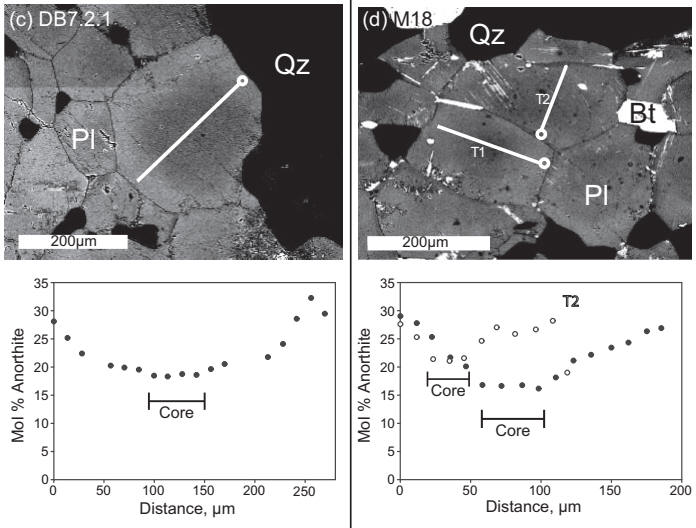 Mark Pearce, working with me, showed that zoning is somewhat concentric (pictured) but could not be explained by usual zoning models, because this is plagioclase growing from itself rather than in a matrix of other minerals. So Pearce and Wheeler (2014 etc.) produced a new model for the zoning and showed how it constrains the previously poorly known pressure-temperature history of the southern Lewisian. |
| Orogenic evolution I have worked on orogenic evolution in the Alps, NW Scotland, Norway and Himalayas. A particular focus was understanding how eclogite facies rocks were unroofed. 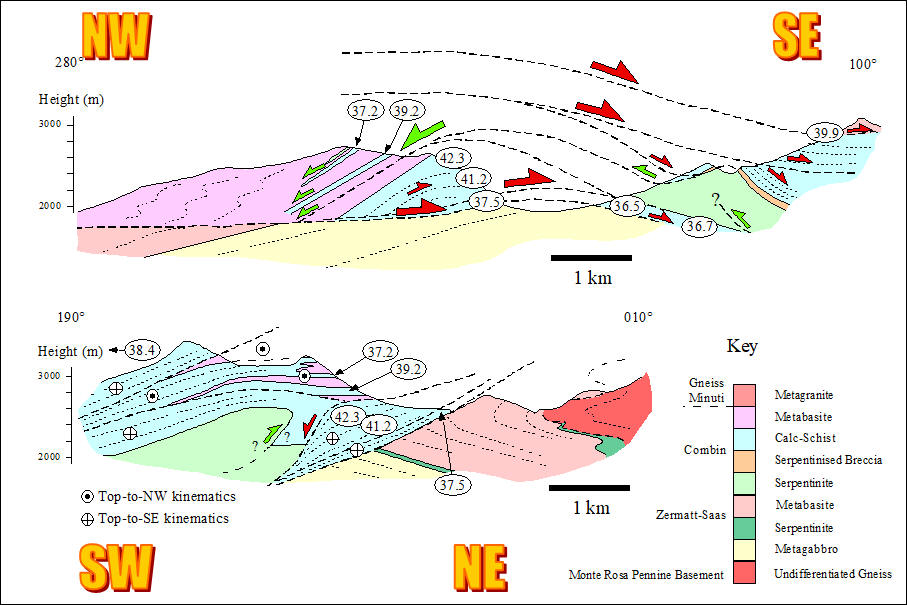 The picture shows cross sections through the Gressoney shear zone in the western Alps. Using field mapping and geochronology, a team of us showed how this shear zone unroofed the eclogite facies units of the Alps - enabling horizontal and vertical movements of the order of 70 km (Reddy et al. 1999). |
| Dehydration reaction fronts These are important as they change pore fluid pressure and might trigger earthquakes. There is an interplay between reaction rate, fluid flow and deformation in the porous matrix. 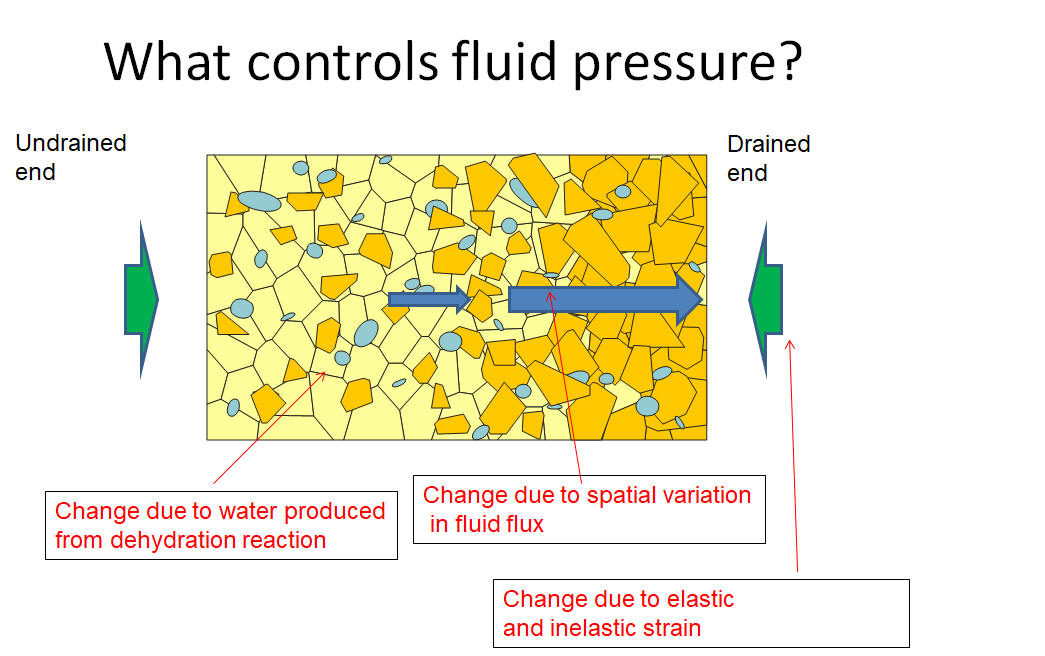 Above is an general sketch of what happens in experiments when one end is drained (fluid can escape) and reaction proceeds faster there. As fluid moves to the right, a reaction "front" moves left. Fluid pressure builds up in the undrained end, until the reaction front reaches it at which point the pressure is released. Below are the results of experiments on dehydrating gypsum, showing the fluid pressure at the downstream, initially undrained end (Leclere et al. 2018). The sudden decrease in pressure records the arrival of the reaction front. This is in accord with model predictions (box above) giving confidence that experimental results can be extrapolated using the model. 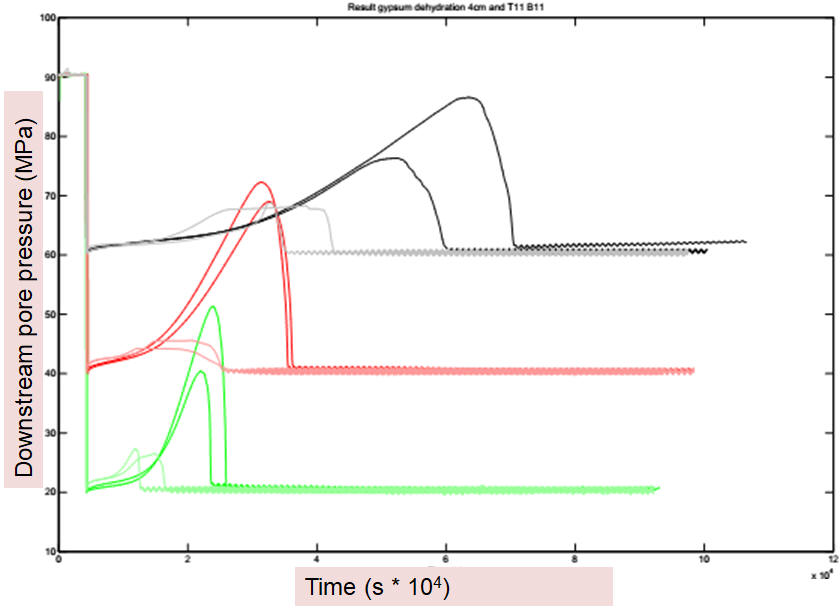 |
| Dehydration leading to strain
localisation If powdered gypsum is sheared during dehydration, we find the reaction is localised along shear bands. Dark grey – gypsum. Light grey – bassanite, a dehydration product of gypsum (Leclere et al. 2016). Strain localisation is a fundamental process in nucleating earthquakes and plate boundaries so demands explanation.  |