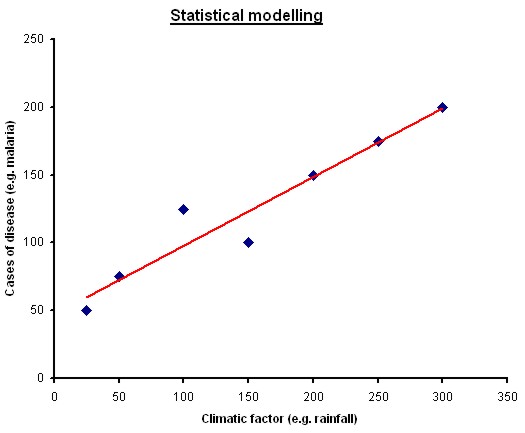
The graph above shows a simplified hypothetical statistical model.
In this model, data from previous years for two variables (a climatic variable such as rainfall, and the number of cases of a disease such as malaria) have been plotted and a line of best fit has been drawn to show the linear relationship between these two factors.
This can then be used to predict how many cases of the disease will occur based on knowing the climatic factor (e.g. rainfall).
So, for example, if we take the x-axis as being rainfall in mm in June and the y-axis as being the number of malaria cases in August, if there has been 150mm of rainfall in June this year, by drawing a line up until we hit the red line of best fit, and then across to the y-axis, we could predict that there will be aprox. 125 cases of malaria in August.