Mathematical
Modelling of Embryogenesis: Gastrulation in Chick Embryo.
Development of embryo, for example the
formation of chick in the egg, is one of the fundamental problems in biology.
One of the earliest stages in embryogenensis is gastrulation - the stage where
the body plan of the future organism is laid down. While before the
gastrulation the embryo is represented by a homogeneous tissue, after the
gastrulation it forms a complex structure with settled axis and asymmetries
where cells of different types form various tissues. This project is devoted to
mathematical study of gastrulation, namely to analysis of the mechanisms of
differentiation and migration of cells during gastrulation. The embryo in this
project can be represented either by continuous model given by a set of partial
differential equations or by individual-cell based model (Cellular Potts Model)
where its dynamics is simulated using Monte-Carlo algorithm.
References:
1. N.
Harrison, R. Diez del Corral, B. Vasiev. Coordination of cell differentiation
and migration in mathematical models of caudal embryonic axis extension – PLoS
ONE 6(7): e22700, 2011. Download.
2. B. Vasiev, A Balter, M Chaplain, J.A.
Glazier, C.J. Weijer. Modeling
Gastrulation in the Chick Embryo: Formation of the Primitive Streak – PloS ONE,
5, e10571, 2010. download.
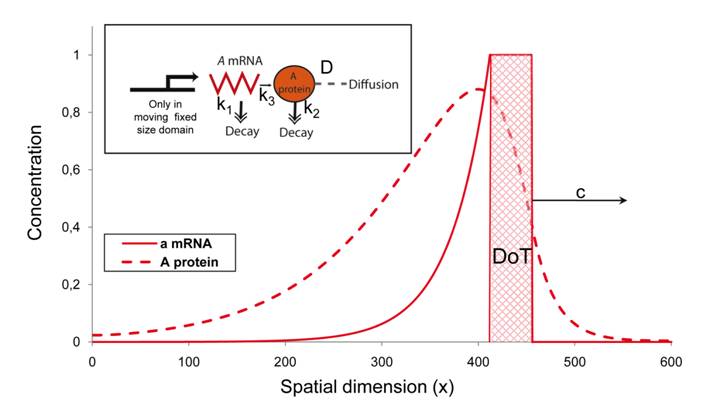
Figure 1 (and
Movie 1).
Stationary concentration profiles of a
gene (A mRNA) and its corresponding protein (chemorepellent) in one-dimensional
model of a migrating group of self-repelling cells. The
solid red line denotes the concentration of A-mRNA
along the embryo’s axis while the dashed red line denotes the concentration of
protein A. A-mRNA is produced in the
DoT, i.e. in the red hatched area which has a preset size and moves to the
right (the x-coordinate points to the posterior side) with speed c.
Production of protein A is proportional to the level of A-mRNA. The schematic gene regulatory network diagram explaining
the underlying molecular model is also presented. The speed of motion, c, is proportional to
the difference in the concentration of the protein on the front and back of the
migrating group of cells.
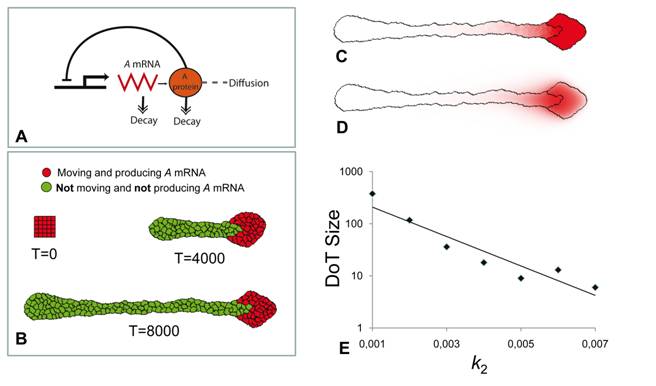
Figure 2 (and Movie 2). The DoT migration in the GGHM. A: Schematic diagram of the used model. B: Three consecutive images from the simulation of primitive streak regression. Initially there is a group of 25 red cells (the DoT) forming a square tissue. The level of A-RNA is high and constant in all red cells. Red cells move (to the right), proliferate and differentiate, i.e. red cell transforms into the green cell when the level of protein A at any point inside the red cell gets above the threshold value TA=0.8. Green cells do not move nor produce A-mRNA, for simplicity we have also assumed that they do not proliferate. Cell differentiation is regulated by the level of morphogen A.