DATASETS
The simulations use daily recorded movements of sheep and
cattle directly between farms and between farms via markets for
2013. Data were obtained from the Animal and Plant Health Agency
(formerly the Animal Health and Veterinary Laboratories Agency, AVHLA) Animal
Movement Licensing system (AMLS) and Cattle tracing System (CTS) databases. The
model uses UK temperature data from UKCP09 5km daily observed archive.
DEFINITIONS
Simulations
The simulations shown here are in each case the median (in
final outbreak size) obtained from 100 stochastic simulations run by
introducing infection into a randomly-selected farm in the specified county on
the specified date.
Movement restrictions
Standard UK bluetongue movement restrictions, according to
current policy, are
applied in the model. Around an affected farm, three zones are set up: a Control Zone (CZ), radius 20km, within which no movements
are allowed. Outside this, and out to 100km, a Protection Zone (PZ) is
defined, within which movements are allowed. Finally, beyond this and
out to a radius of 150km, is the Surveillance Zone
(SZ), within which movements are allowed. Movements are also allowed
from the SZ to the PZ and from the "free area" (outside all
zones) to the SZ or PZ. If "No restrictions" is selected, zones
are ignored and movements are only prevented from farms on which infection
has been directly detected.
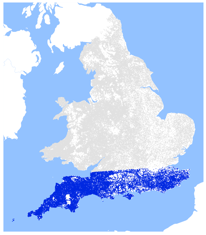
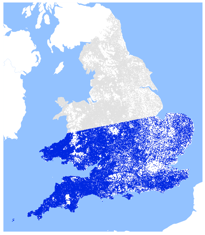
Vaccination
Pre-emptive vaccination is simulated at
two different coverage levels (a randomly-selected 25% and 50% of farms) within
a specified area. All farms in the
respective zone are coloured blue, with the other farms in grey.
|
|
|
Temperature
The simulations were driven
by UKCP09 temperatures for individual years selected from the
period 2006-2015. Temperatures are referenced with respect to the
UKCP09-derived England and Wales mean temperature over May to October,
which for this period was 13.8 degrees: "very high": 1.4 degC above the mean; "above average": 0.5 degC above the mean; "below average": 0.3 degC below the mean.
Affected farms
Affected farms are
those which have experienced at least one BT infected cow or sheep.
DISCLAIMER/COPYRIGHT STATEMENT
This website is provided for information only. The animations shown
here are model estimations and do not contain any recorded
observations of Bluetongue-affected farms. The model estimations are based
on past climate and animal movement data, they are illustrative only and do
not constitute any sort of forecast for current or future
conditions. The University of Liverpool shall not be responsible or in any
way liable for any errors, omissions or inaccuracies on the website whether
arising from negligence or otherwise howsoever or for any consequences arising
therefrom. In no event shall The University of Liverpool be liable for any loss
or damages of any kind arising from the use of, or inability to use, or from
any content on our website or linked sites, including but not limited to,
direct, indirect, incidental, consequential, and punitive damages.
© University of Liverpool 2017. All aspects
of this website - design, text, graphics, applications, software, underlying
source code and all other aspects - are copyright The University of
Liverpool. In accessing these web pages, you agree that any downloading of
content is for personal, non-commercial reference only. No part of this Site
may be reproduced or transmitted in any form or by any means, electronic,
mechanical, photocopying, recording or otherwise, without our prior
permission. For rights clearance please contact us.
For more information, contact lucinda.group@gmail.com
ACKNOWLEDGEMENTS
© Crown Copyright 2009. The UK Climate Projections (UKCP09) have been
made available by the Department for Environment, Food and Rural Affairs
(Defra) and the Department of Energy and Climate Change (DECC) under licence
from the Met Office, UKCIP, British Atmospheric Data Centre, Newcastle
University, University of East Anglia, Environment Agency, Tyndall Centre and Proudman Oceanographic Laboratory. These organisations give
no warranties, express or implied, as to the accuracy of the UKCP09 and do not
accept any liability for loss or damage, which may arise from reliance upon the
UKCP09 and any use of the UKCP09 is undertaken entirely at the user’s risk.