This is a scanning electron microscopy technique in which diffraction patterns formed by electrons interacting with the regular structures of crystal lattices are used to deduce lattice orientations. My research focus is on developing techniques to help us understand evolution of crystalline materials using such data. I have developed my own software ("Crystalscape") to move beyond what is offered in other analysis packages. In particular I devised the "Weighted Burgers Vector" (WBV) method for analysing intracrystalline distortion.
I've applied EBSD to metals and ice as well as rock-forming minerals.
Some examples of EBSD applications in a poster presented at Tectonic Studies Group AGM 2023 here. If you want to use material from the first (unpublished) case study, please ask me.
Wheeler EBSD profile here.
Wheeler papers using Crystalscape software - all topics here.
Wheeler papers using Crystalscape software - WBV in particular here.
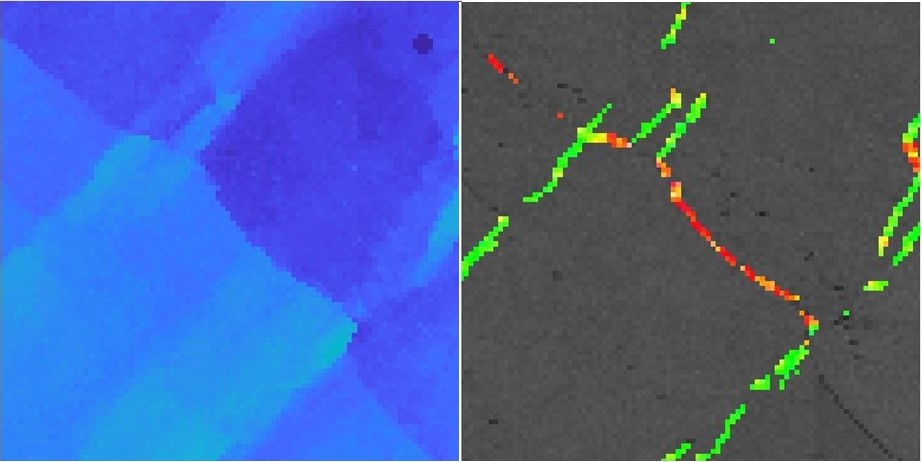
One technique I have developed is for analysing dislocation density: the "Weighted Burgers Vector" method (Wheeler et al. 2009). The left picture shows a map of distorted olivine, colour coded for misorientation relative to a reference point. The right picture shows subgrain walls colour coded for the direction of likely Burgers vectors using a technique I developed. Green indicates the [100] direction and red is [001], so such maps can assist in diagnosing active slip systems.Thanks to Jake Tielke for this dataset. A commercial version of the algorithm was released by Oxford Instruments Nanoanalysis in 2022: see the OINA webinar and more information. My Matlab code can still be used for non-commercial research. I am happy to discuss the technique with any user, academic or commercial. |
|
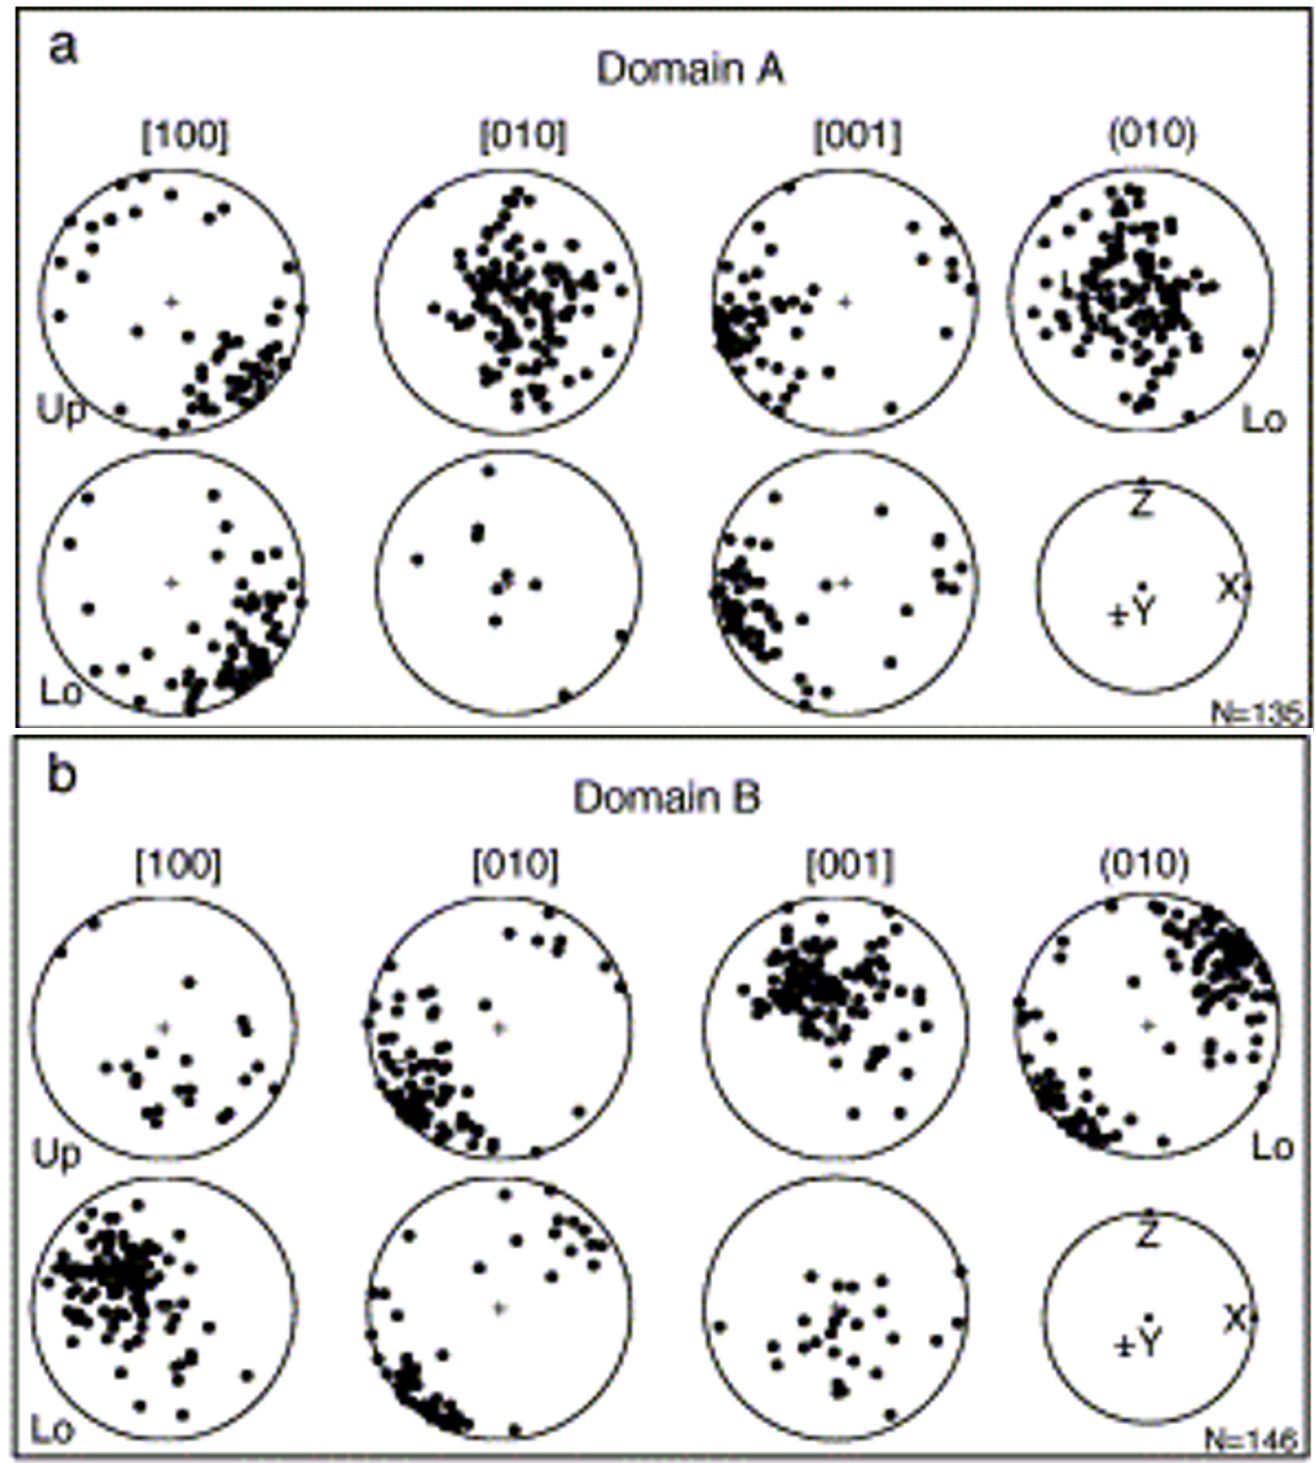
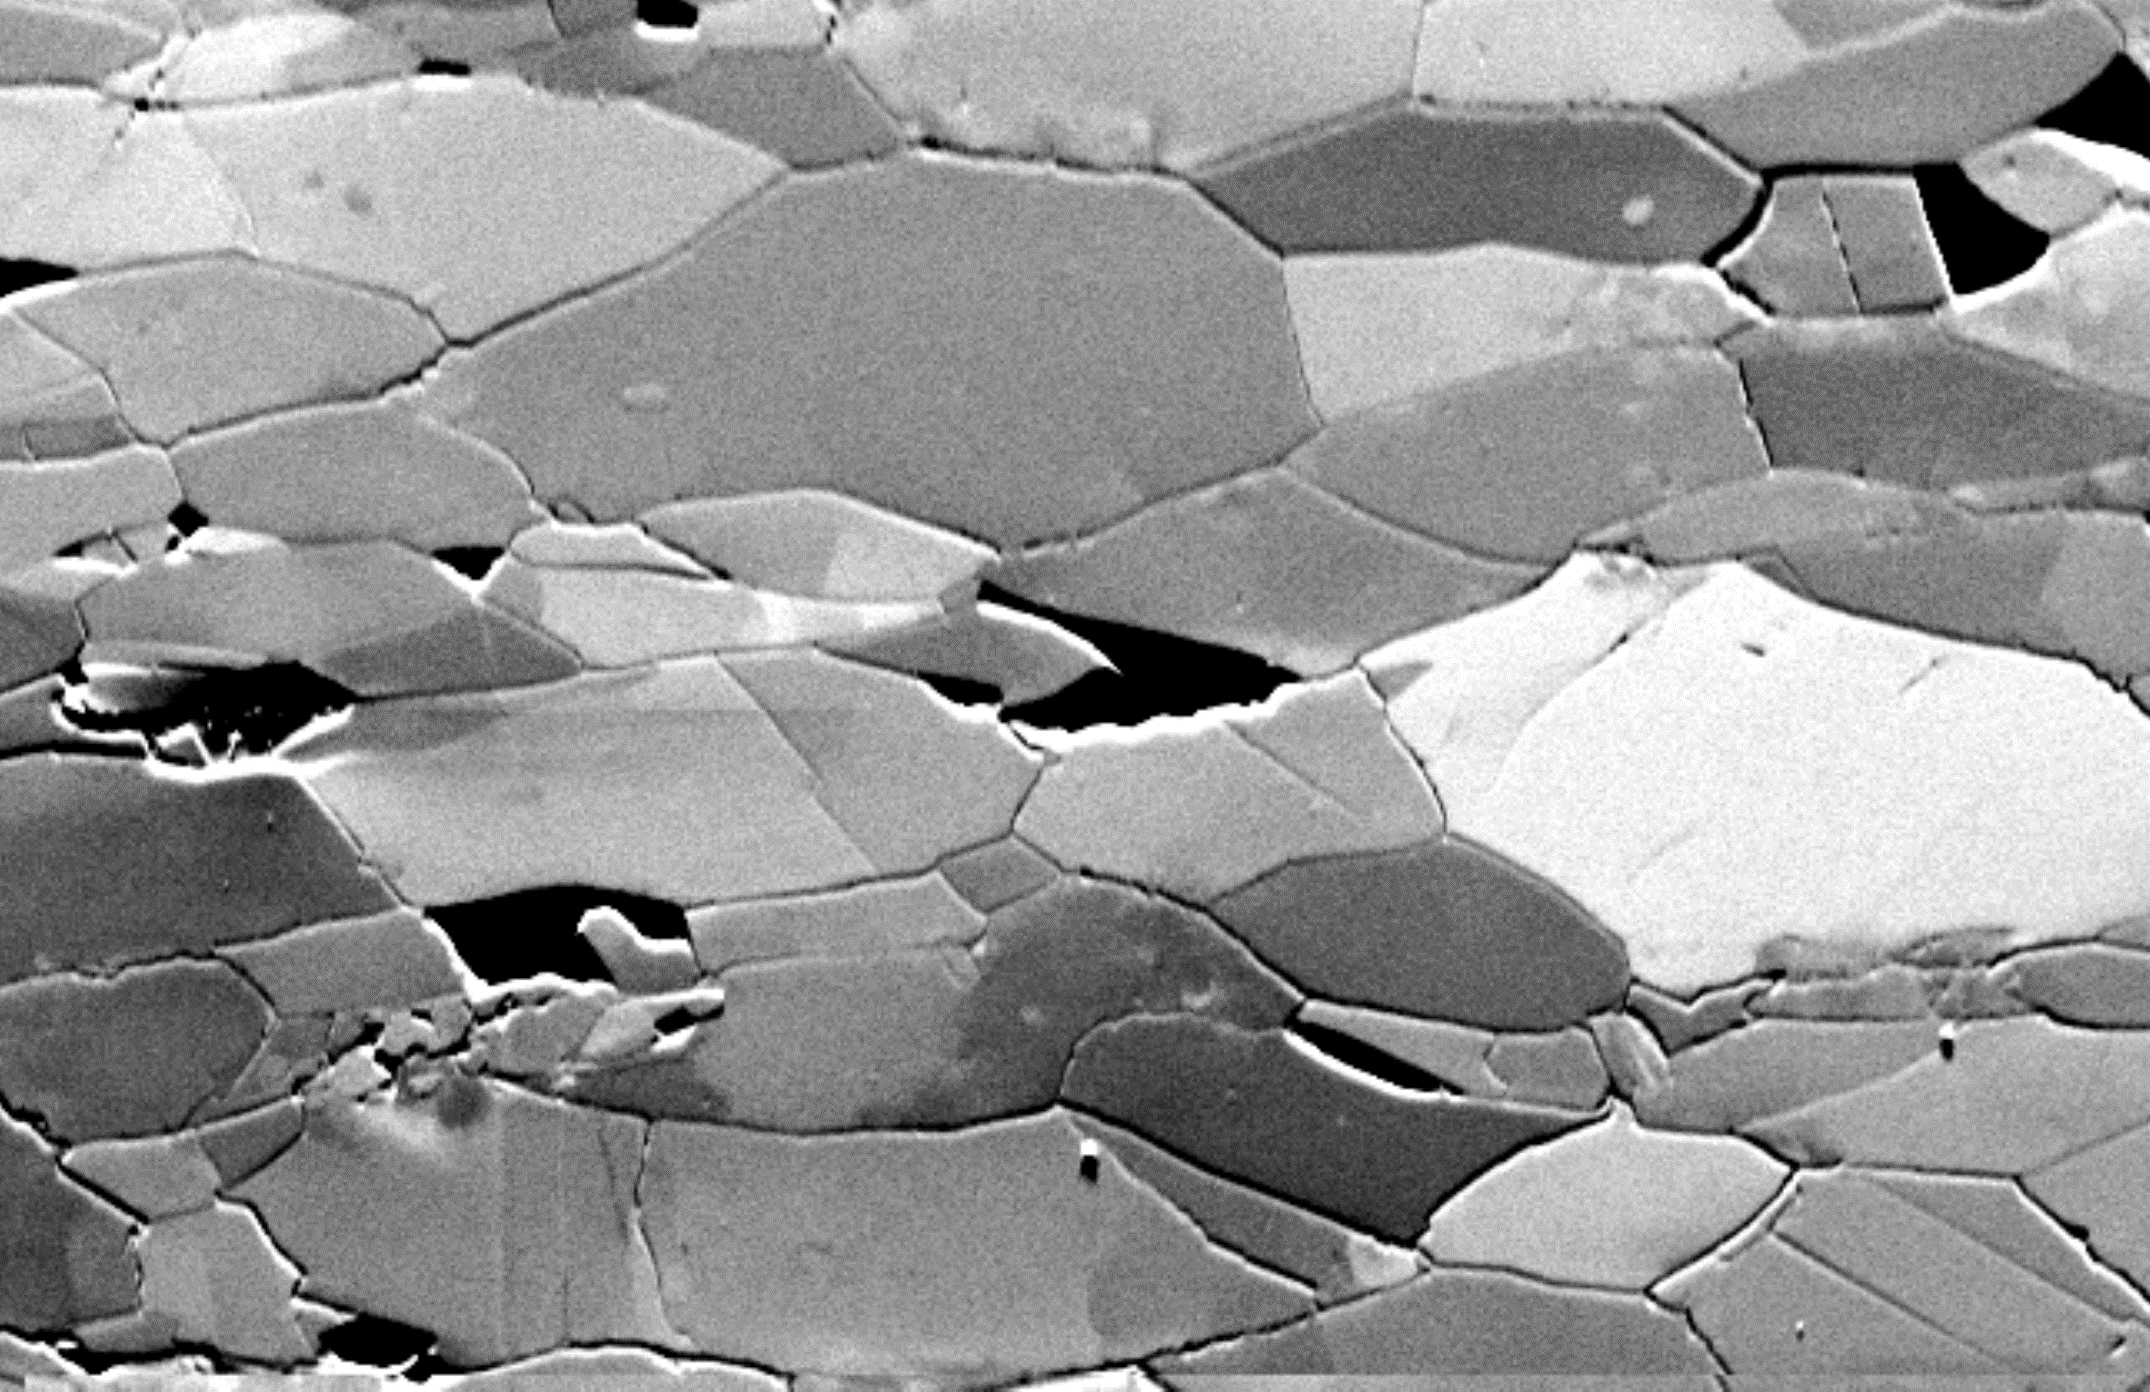
The left-hand image shows a grey scale ("forescatter") image of orientations of albite from a deformed metagabbro. The right-hand image shows pole figures for various crystal directions from two separate layers, a and b. The two layers show very different patterns, not what we would expect in a rock deformed by dislocation creep. We argue instead that the layers are smeared out relics of individual large plagioclase grains; the original plagioclase orientation leaves a distinct signature in each layer and the deformation mechanism was diffusion creep (Jiang et al. 2001). | |
The left-hand image is deformed Mg metal, colour coded for orientation. The centre image is the same area after heating and some consequent recrystallisation. The right hand image shows the orientation changes after heating. Dark blue means no orientation change; other colours show where grain boundaries have moved. This "time lapse misorientation" map provides new insights into how recrystallisation occurs (Wheeler et al. 2011). | |
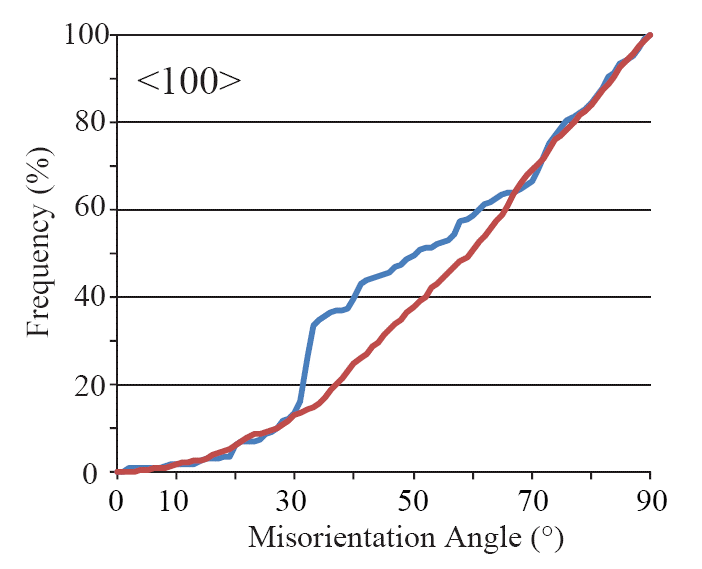
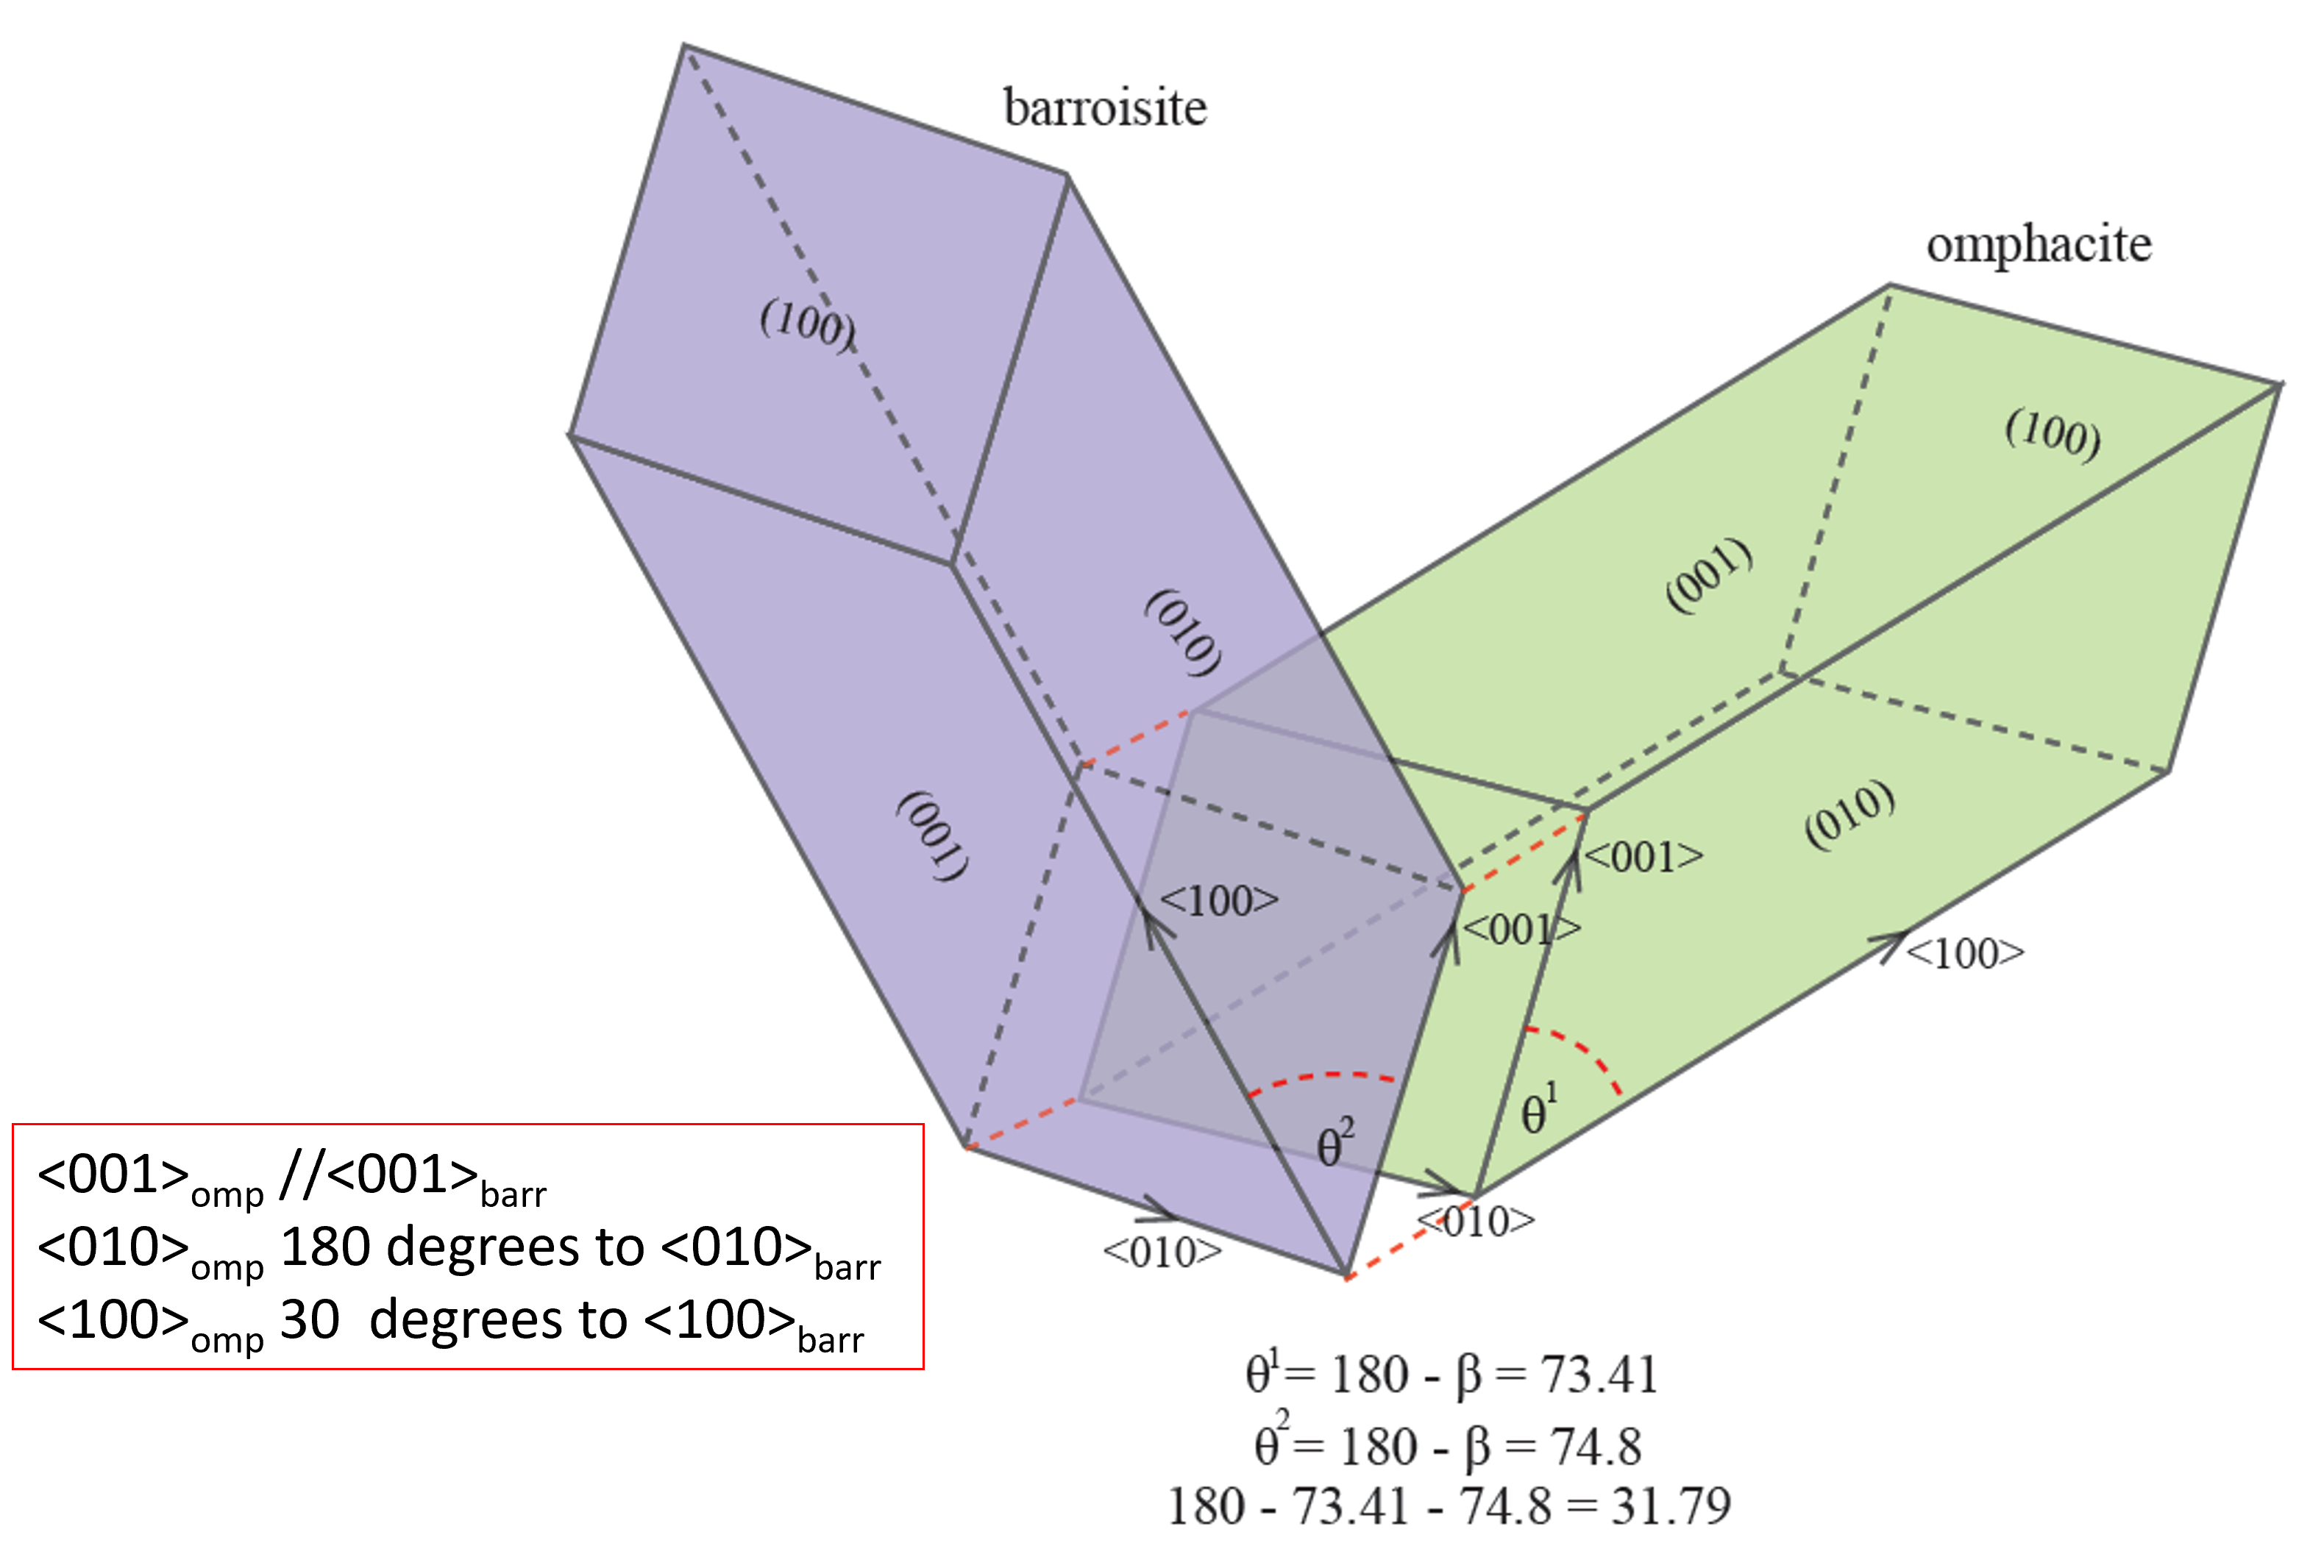
Omphacite and barroisite both occur in a deformed eclogite from the Alps. Both have strong crystallographic preferred orientation (CPO) which might imply both were deformed. The left-hand graphs are cumulative histograms showing the angles between <100> in barroisite and omphacite when the comparison grains are picked at random (red) or are touching (blue). The "kick" at 30 degrees in the blue graph shows that omphacite controlled the nucleation of later barroisite, with an orientation relationship shown in the right hand figure. The barroisite CPO was inherited from the omphacite CPO and not itself due to deformation (Mcnamara et al. 2012). |