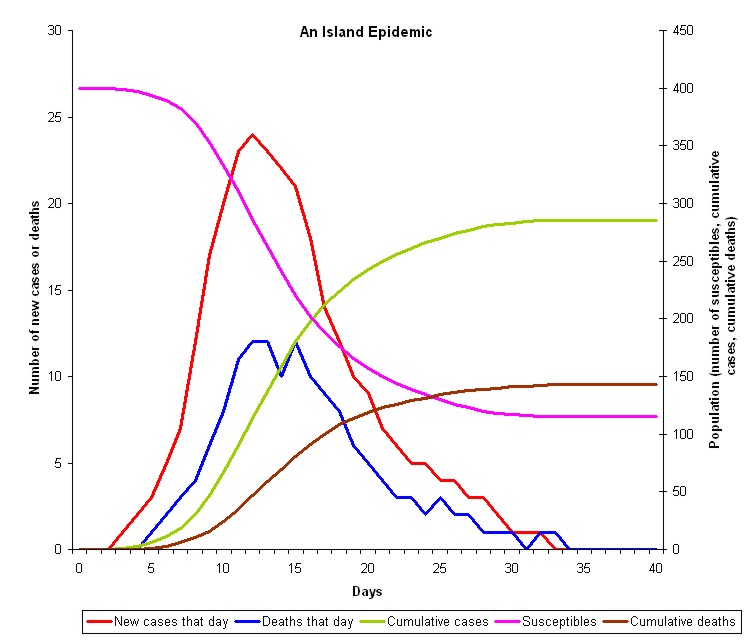
The graph below plots the data for the island epidemic.
Click on each line to see an explanation of what it shows. (Click away from other lines so that they don't get mixed up).
| Close window | ||
The graph below plots the data for the island epidemic. Click on each line to see an explanation of what it shows. (Click away from other lines so that they don't get mixed up).
|
||
| Close window | ||