|
 |
 |
 |
 |
 |
 |
Section 3: MALARIA & MODELLING

Modelling
Contents:
E:
Modelling of a system, including an epidemic, allows us to predict events which haven't happened yet. There are a number of different modelling approaches but they fit roughly within three classes: statistical; rules-based; and dynamic.
Statistical models
Statistical models are created from known relationships between events e.g. the amount of rainfall and the number of malaria cases - more rainfall increases the number of breeding sites available for mosquitoes (for more details see the biology pages).
For example, peaks in the number of malaria cases in tropical countries occur about two months after the rainy season.
This is because the rains provide more sites for the mosquito larvae to develop, but there is a delay because this takes time for the mosquitoes to mature and it also takes time from when a human is bitten to when they become infectious (see biology pages). It also takes time for the number of cases to build up to the peak level.
By producing a model based on the past relationship between these two factors (amount and time of rainfall and the number and timing of malaria cases), a statistical model can be produced which can be used to predict the number of cases of malaria for this year based on how much rainfall there has been.
The graph on the left shows a hypothetical statistical model. Click on it to see a bigger version and further explanation.
However, there are two issues with modelling in this way:
1. it is difficult to get the amount of good quality data which are needed for this type of modelling. For example, quality assured malaria data for more than a few years are very difficult to find for most African countries. The more years of good data there are, the more reliable the model is. But in some countries (especially in Africa) these data sets are often incomplete or non-existent;
2. the relationship between the two factors might not be as straight forward as it first appears as other factors may also be important.
A statistical model is a 'black box approach' - it only deals with the inputs and outputs, not the processes. That is, it doesn't attampt to understand the reason why there is a relationship between two factors, it just plots this relationship.
For example, using our example from above, there are many factors other than rainfall which may affect the number of cases of malaria. There may be the same amount of rainfall as a previous year, but the temperature may have been different and so the number of cases of malaria may not fit the model. Real life is more complex than the model.
These problems are made worse when a model developed using data from one location is used to make predictions in another area. The balance between different factors may be widely different in different places.
Rules-based models
Rules based models take each location or grid cell in turn and are driven by a set of rules. They try to predict the risk of an area being affected by something (e.g. a disease) by asking if that area satisfies a series of conditions known to be important in determining the presence of that disease.
For example, a rules based model may predict the risk of malaria occurring in certain areas in certain months by asking if it satisfies the following conditions:
- rainfall is above a certain level (threshold);
- temperature is above a certain threshold;
- the population density is above a certain threshold.
The most common rules based models for malaria are normally driven by monthly climate data, which can be used to estimate the time the vector and mosquito take to develop.
Again, issues arise because the model simplifies what happens in the 'real world', but this method does have an advantage over statistical modelling. Unlike statistical modelling, rules based models can be more easily applied outside the area they were developed for. The rules may be developed by using data from areas which have good quality malaria data, but these rules can then be applied to areas for which there is no malaria data to calculate the risk of malaria being present.
In addition to this, there isn't a limit on the number of factors in a rules based model. Additional factors known to have an affect on malaria risk such as land use and immunological factors can be factored into the model in addition to the climatic data.
The models can also be tuned' by comparing their output with known occurrences of malaria to test their success.
The output is often in a form of a average risk map such as the one on the left. Click on the map to see details of the rules used to produce it.
Dynamic models
A rules based model only takes into account whether a condition is satisfied or not, but a dynamic model takes into account the links between the different factors.
So, in the case of malaria, a dynamic model may involve linking rainfall variations with temperature fluctuations which drive the vector and parasite fluctuations, and then linking these with mosquito population size. It would then use a combination of the variations in all these factors (taking into account that if one changes it may have a knock on affect, changing other variables) to predict malaria cases.
Dynamic models are therefore much more complex than either statistical or rules based models.
So, for example, for a certain day, a rules based model may tell you that malaria isn't present because the temperature is too low. But malaria may in fact be present because the temperature in previous days was high enough for mosquito development and these mosquitoes will still be infectious. A dynamic model would take this into account.
Dynamic malaria models try to reproduce the evolution of seasonally endemic malaria cases or malaria epidemics which are driven externally by daily weather information.

Click on graph to see bigger version

Click on map to see bigger version

Click on map to see a bigger version
All of the models can be used to produce maps showing the risk of contracting malaria in different places at different times of year.
In the case of countries where malaria is not endemic, epidemics of malaria normally occur in years with anomolous weather conditions (e.g. high rainfall in normally dry areas).
All three modelling approaches could be used to identify areas at risk in such a year, but rules-based and dynamic models have most potential in this area because a statistical model assumes a constant relationship between the two variables.
In addition to this, only dynamic models have potential for assessing the impacts of interventions on malaria transmission, for example the timing of spraying regimes and the increased use of bed nets.
This type of model can allow economic cost-loss studies to be produced to help public health agencies to decide the best intervention strategy in countries with resource shortages. As with many diseases, prevention of malaria is generally cheaper than cure, and so it is important to correctly time and target intervention strategies likely to deliver the most cost effective solution (see the control pages for more information on prevention strategies).
Work is currently underway by researchers at the University of Liverpool to link a dynamic predictive malaria model with weather' models that given very long range seasonal prediction (up to six months ahead). This will allow the risk of malaria in a region to be predicted up to eight months in advance based on the weather forecast (six months forecast plus the two months it takes for the peak in malaria cases to take affect) . If the dynamic model is used on its own, it can only predict up to two months in advance as it is based on knowing current weather conditions rather than future conditions.
The final use of modelling is to look at the potential impacts of future climate change or future increases in climatic variability (for example global warming) on malaria. This will help to determine the parts of the world where, in a changed climate, there may be an increased risk of malaria.

Spraying DDT to control malaria. Click to see bigger version
Click for excel model
The link on the left takes you to an Excel spreadsheet that is coded with a fairly simple model containing many of the governing equations found in a dynamic model. Click on the graph to open the model. You will need excel on your computer in order to use this.
The information which follows on this page explains the model. What we suggest you do it print a version of this information by clicking here (word version) or here (pdf version), and read through it as you are looking at the model as it will make more sense if you can see the data.
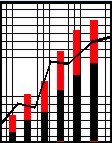
The model is driven by monthly data on temperature and rainfall. These data are displayed in the two graphs on the right hand side (temperature in red and rainfall in blue) and the output is the graph on the left (purple). This shows a malaria transmission potential (the risk of malaria being transmitted).
The parameters for the model (the factors considered) are shown in the top left of the spreadsheet. What follows is a brief description of these:
1. Human Blood Index
The human blood index is the proportion of mosquito bites on humans compared with animals. The biting rate is driven by the time it takes to complete a gonotrophic cycle (egg production / laying cycle of the female mosquito see biology) as the female mosquito needs a blood meal for each batch of eggs she produces.
This is therefore closely linked to the gonotrophic, sporogonic and mosquito survival variables.
2. Mosquito survival
Mosquitoes are vulnerable to predations especially whilst they are resting after a blood meal. The survival probability is the proportion of mosquitoes which survive each blood meal and therefore complete each gonotrophic cycle.
The key issue here is that when the temperature gets almost as low as the sporogonic cycle threshold (18oC) the sporogonic cycle will take so long that it is unlikely that the mosquito will live long enough for it to be completed.
3. Sporogonic factors
The sporogonic cycle (the development of the parasite within the mosquito see biology) is governed by temperature. This is a complex relationship which is strongly dependent on mosquito survival, which is in turn linked to temperature. The sporogonic cycle requires a minimum temperature to occur, then it occurs more quickly if the temperature is consistently high, but must not bee too high as that will mean that the mosquito will die before the cycle is complete.
The units used for the length of sporogonic cycle are degree days. This is a complex term, but an easy way to think about it is in terms of energy. A certain amount of energy is needed for the cycle to be completed. This energy comes from heat. A certain amount of heat is therefore needed. So, if the heat for each day is added up and it is enough then the cycle is able to occur. This cannot however happen over an infinite time in the case of malaria as if the required amount of heat isn't reached within the mosquito's lifetime, the sporogonic cycle will not occur.
4. Gonotrophic factors
The gonotrophic cycle (the egg production/laying cycle of the female mosquito) is controlled by temperature (see biology pages).
Like the sporogonic cycle, the length of the gonotrophic cycle is measured in degree days and the gonotrophic cycle is the minimum temperature required for mosquito reproduction. Both the number of degree days required and the temperature threshold are lower for the gonotrophic cycle compared to those for the sporogonic cycle.
7. Rainfall threshold
As described in the biology pages, mosquitoes require bodies of still water in order to reproduce. Rainfall is therefore needed in order to provide this water.
The rainfall threshold in the model means that the model only allows for malaria to develop in times when there is sustained rainfall. The units used are mm per month. The rules based model provided by MARA which was described above used 80mm as the minimum. However, when this is put into this model this means that there is no malaria. Malaria can occur with lower rainfall, especially when there are other sources of water (e.g. rivers).
Most agricultural models use 10-20mm as the threshold and we suggest that 10mm is used a first starting point for this model.
8. Temperature increment
The temperature data is the average daily maximum. Because this is an average and a maximum, the actual values are likely to be less.
The temperature increment allows this difference to be factored into the model. We suggest that the daily temperature will be between 5 and 8 degrees less than the average daily maximum, and so the temperature increment is set at 5.
Exploring the model
To explore the model we suggest you leave the values for both gonotrophic and sporogonic cycles as originally set.
Original Values
Human blood index 0.8 |
Mosquito survival probability per gonotrophic cycle 0.5 |
Length of sporogonic cycle 111 |
Sporogonic threshold 18 |
Length of gonotrophic cycle 37 |
Gonotrophic threshold 9 |
Rainfall threshold (sustained for 4 months) 10 |
Temperature increment (-/+) -5 |
The figures in bold and highlighted - human blood index, mosquito survival, rainfall threshold and temperature increment - can all be changed.
We suggest that you look at the sensitivity of the model by changing each value in turn. Change the values a little at a time (the model may crash if you go too far) and start by just varying one parameter.
Look at the effect your changes have on the graph of malaria transmission potential. In each case see how the malaria transmission varies across the three years which are the start and end month, how high is the peak and estimate the areas under the epidemic curves in each year.
See how the transmission values relate to the time series of temperature and rainfall and how these vary from year to year.
Rainfall
A good place to start is changing the rainfall threshold. Look at the effect of increasing the threshold which means that more rain is required across four consecutive months to allow the malaria to start to develop, or reduce it to see the affect of requiring less rain.
Then move onto the temperature but first return the rainfall setting to the original value.
Temperature
You can raise the average temperature by changing the temperature increment to a smaller negative number e.g. 2. Look at the temperature graph (red) first to see the effect this has on average monthly temperatures and then look at the effect this has on the transmission potential graph (purple).
To lower the average temperature put a larger negative number in the temperature increment (e.g. 8).
This may mean that for some months the temperature is not above the 18 degree Celsius sporogonic threshold and so there is not transmission potential (or this may reduce transmission potential by lowering the sporogonic and gonotrophic cycle measures below the degree day thresholds.
Mosquito survival
Put the temperature setting back to the original value.
Now look at the mosquito survival. At 0.5, this means that only half the female mosquitoes that go for a blood meal survive to lay their eggs at the end of that cycle.
This value is within the range of published values. Increase this value to 0.6 so 60% of the mosquitoes survive and see the impact on the transmission potential .
Then try a range of other values.
Multiple changes
OK you are probably ready to start varying more than one parameter at a time. Try changing all three of these parameters. What you may find is that it becomes difficult to follow what is causing what effect. This is a good illustration as to why we use models to do the work for us!