London
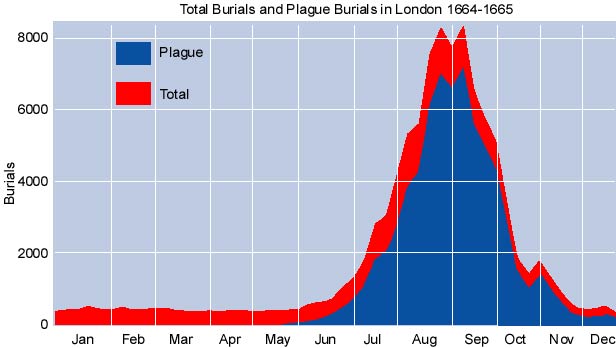
The graph below shows the total number of burials and the number of plague burials in London in 1664-1665. You can clearly see the seasonal variation in plague deaths, with the highest number being in the warm, summer months.
The case of Tudor and Stuart London illustrates a further complication to making any serious evaluation of the impact of plague.
The Bills of Mortality provided an early warning system. If plague deaths began to rise in spring those in the know' could take avoiding action by leaving town for the countryside or some other town as yet unaffected. This action of fleeing from plague areas is illustrated in this picture below:
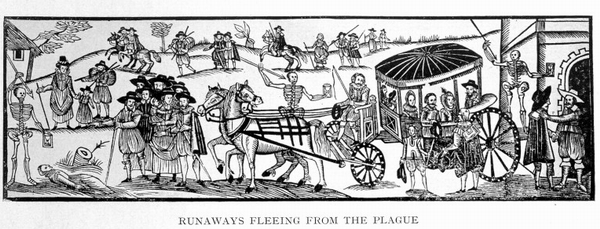
Source: Wellcome Library
This flight from plague was a sound strategy, it was adopted by members of the Royal Court and Parliament, and anyone else who could afford to leave. Only the poor, the foolhardy and officials who were obliged to stay were left to face the plague.
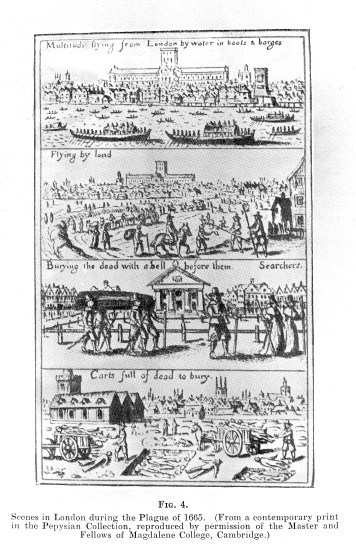 This picture shows scenes from London during the Plague of 1665.
The top two pictures illustrate this migration from London.
The first picture shows people fleeing from London by water.
The second picture shows people fleeing by land.
The bottom two pictures illustrate deaths.
The first is of people carrying a coffin to burial with a person walking in front of them ringing a bell to signify plague death
And the bottom picture shows carts of dead people (without coffins) being buried in plague pits.
Source: Wellcome Library
The plague also prevented possible visitors and migrants from going to town during an epidemic. However, this practice also meant that the at risk' population (the denominator in any death rate) could be temporarily and substantially reduced. The death rate for any period of plague epidemic would therefore be inflated because a significant minority of the normal population might be away.
Click on 'eg' below to see an worked example of the effect of migration on death rate.
